We are driven by curiosity. We have a penchant for seeking out new experience, original knowledge and candid feedback. Read this section for our thoughts, our insights, and a few opinions.
2003 Market Outlook
Hillsdale Outlook for March 2003
After suffering their worst draw down since 1974, US markets rallied smartly from October 2002 to January 2003 with the S&P 500 rising almost 20%. However, with the threat of war and significant concern over future earnings growth, the S&P slid back towards the 800 level and threatened to re-visit previous lows by early February. Considering the high level of underlying stock volatility and the general feeling of uncertainty in the markets, we thought it would be worthwhile to re-focus on the true long-term drivers of equity prices.
Monetary policy continues to remain supportive with the Fed maintaining its aggressive rate setting policies. The current Fed rate of 1.25% has been in place since late 2002. This is the lowest rate, for that long a period, since the summer of 1958 and has resulted in real cash yields falling below 0% for the first time since the late 1970s. As we have noted before, the risk in such as aggressive stance by the Fed is such that “if liquidity is over manipulated [...] in the long term, market participants will adjust their behaviour accordingly and the effectiveness of such a policy will be reduced“. For now, though, it is too early to infer that monetary stimulus has been rendered ineffective (as has been the case in Japan during the late 1990s).
From a valuation perspective, much has been made of S&P 500 trailing P/E level of 18. This is higher than any previous market bottom. Following the 1990 recession, the P/E was 12, after the October 1987 crash, the P/E was 14 and after the 1982 recession the P/E was 7. However, at these points in time, cash was yielding 7.4%, 6.4% and 12.6% respectively. Bonds were yielding 8.8%, 9.5% and 10.5% during those same periods. If cash rates were at those levels today, we would say the market is expensive. Today, US 3 month T-bills are yielding 1.2%. Thus, the market is currently not expensive versus cash. With inflation currently running at 4%, after-tax cash investments are now netting a -3% real rate of return. The US 10 Year Bond is yielding less than 4% (before inflation) and the stock market is the cheapest it has been versus bonds since 1980.
To be fair, given the enormity of the bubble and the imbalances that it created, the post mania environment cannot be judged solely on fundamental drivers. As is similar to Japan and its post bubble market of the early 90s, serious structural issues need to be addressed. In our July 2002 commentary, we noted that three of the most important issues that needed to be addressed were, removing tax discrepancies between dividend income and capital gains, re-standardizing accounting rules and realigning executive incentives more closely with those of shareholders. We noted at the time that improvements in these areas “would go a long way towards instilling some trust back in the market and providing a solid base for equity valuations.“
Since that time, the most serious suggestions for reform have been made by President Bush with his proposal to end the double taxation of dividends included as part of his $600 billion economic stimulus package. While the issue now rests with Congress, it has certainly been addressed and resolutely corrected at the highest level. The practice of paying dividends to instil more confidence in earnings declarations has been greatly aided by Microsoft’s recent move to begin paying them, as well as other tech stalwarts’, Cisco and Oracle, decision to consider doing the same. With many companies now placing more emphasis on stock based compensation as opposed to relying solely on options, progress has even been made in the area of aligning executive compensation with shareholder interests. Furthermore, leading companies, such as Amazon, Coca-Cola and Bank of America have started acknowledging the cost of options by including them on their income statements. These moves will help focus the market on the true earnings capabilities of such firms and attach valuations that at least bear some semblance to reality. The re-vamping and standardization of accounting rules will probably be the hardest issue to correct. However, with the end of the tumultuous term of Harvey Pitt as Chairman of the SEC and the recent appointment of William Donaldson as chair, the issue will be given first priority. Donaldson aims to appoint a leader for the Public Company Accounting Oversight Board as soon as possible. While none of these issues have been resolved, the speed with which they have been addressed is positive and represents a critical first step in providing a better base for equity valuations.
It is important to mention that, as we compare these issues with markets a**cross the border, the differences between the US and Canada are starting to become noteworthy**. From a structural viewpoint, the Canadian market was not as severely damaged:
1. there have been no major examples of accounting fraud,
2. the stock mania and options abuse was limited to a relatively limited small number of firms and
3. the disparity between dividend income and capital gains was not as great, as Canadian tax law, while still engaging in double taxation, at least provides a dividend tax credit to lessen the impact.
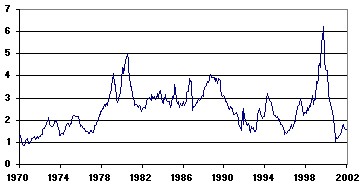
Canadian monetary policy remains supportive and net liquidity remains well within its historic range of the past 20 years. In addition, it is not as aggressive as in the US nor is it near the inflationary levels of the 1970s. The valuation picture for stocks in Canada also looks better versus both cash and bonds, mainly because real yields are at lower lows than in the US. As the following graph shows, with the TSX yielding 1.9% and T-bills yielding 2.9%, the Cash to Yield ratio of 1.5 has re-visited one of it’s lowest levels in 25 years.
Canada Equity Risk Premium vs. 90 Day T-Bill
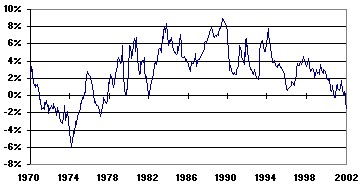
Canadian stocks look cheap versus cash, but more importantly, real returns on cash are now at -1%, a level that has not been seen since 1977. After paying taxes, investors are actually down by almost 3%.
Canada – Real Rate of Return from 90 Day T-Bill
With long-term Canadian bonds yielding 5%, the bond / stock yield ratio is at 2.6 which is low by historic standards and less than the long-term average of approximately 3.5 times. Of greater concern for bondholders is the fact that real returns are now less than 1%, the worst level since 1981. After paying taxes, investors are left with a real return approaching -2%. With real rates at historic lows, a long duration bond portfolio offers significant downside risk.
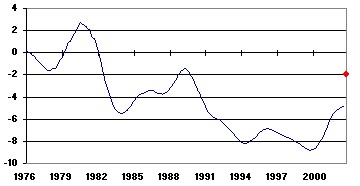
What is most surprising is that the ROE gap between US companies and Canadian companies has started to narrow. After averaging almost 8% less than US firms for most of the 90s, Canadian firms have now narrowed the gap to near 4%, a level last reached in the late 80s. Add to this the difference in projected earnings growth rates and the gap could become less than 2% by year-end.
ROE Gap Canada VS US (24 Month Smoothing)
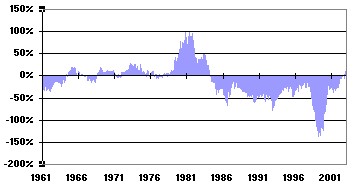
The last time the Canadian market beat the US market for a sustained period of time was in the late 1970s and is coincident with Canadian firms having a higher ROE than US firms.
Net Rolling 5 Years Return: S&P/TSX – S&P 500
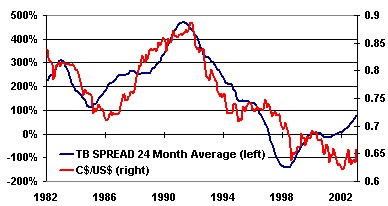
The US dollar continues to be devalued against other currencies, (from the Euro to the Yen) and vis a vis the CRB index and the price of gold. The Canadian dollar, on the other hand, has a reasonable chance of maintaining its value or even appreciating in value against the US dollar, for the first time in 10 years. Adding further support to this claim is the fact that the gap between short-term rates now favours Canada over the US and indicates a reversal of a slide that began over 10 years ago. As the attached graphs shows the Canadian/US dollar exchange rate has correlated fairly closely with the rolling 24-month gap between short term rates in the two countries. The last time the gap grew to a significant level was during the 1986 to 1990 period, a time coincident with a strong rise in the value of Canadian dollar versus the US dollar.
CDN/US $ versus the Cdn tb90/US
Based on the aforementioned macro factors and the fact that Canadian economic growth continues to rank near the top within the G-7 we feel that many international investors, particularly those in the US, will consider now to be a good time to overweight Canadian equities. And while we expect equity markets to remain volatile going forward, we have seen some evidence that volatility has started to decline and is running at levels below those experienced in 2001 and 2002. In the final analysis, we continue to encourage investors to select managers that not only have a demonstrated ability to generate alpha but also have a clearly articulated risk and beta policy within their stock selection process.
As always, we would be pleased to assist you in these endeavors.
Regards,
Chris Guthrie
President & CEO
Arun Kaul
Executive VP & COO